New here, and first post. I am new, and don’t really have a clue at this point.
Recently, using ASTAP, I looked at some images of M11 (about 150 FITS @ 10sec each) using my SeeStar S50. I was able to capture all the variable stars, with check and comparison stars. All the data was generated, and I looked at the AAVSO report. In looking at the report, I noticed what I thought were large error bars. How large is too large? The SNR was good (greater than 100), and the stars were not saturated.
Hi Scott,
if your SNR is greater than 100 than your errors on the magnitudes should be smaller than 0.01 mag. That’s pretty small. Large errors are in the 0.2-0.5 mag range.
Regards
Josch
Thank you very much. I wasn’t sure the sort of variability to expect with regard to SNR. One issue I am having, is that images are taken every 10 seconds. I am trying to figure out a method to stack groups of 6 or more to improve SNR and reduce the amount of variability.
I guess I need to look at standard deviation of check stars, to see what sort of error occurs.
I spent some time last night tracking VV UMa last night using my SeeStar S50. I took about 3 hours of 10 sec subs, then grouped and stacked them using ASTAP into 60 sec subs, and measured the change in magnitude. Looking at the data, it looks nice and smooth, and within the expected range.
The eclipse light curve certainly looks reasonable. It would be nice to know how much scatter (standard deviation) you observed for the check/comp star. Can you calculate and report that value (precision). It’s a little hard to estimate with the magnitude scale used in the plot.
One of the comparison stars was a little close to the edge of the image, so had a lot lower SNR. One of the issues I found, is that the SeeStar S50 uses Jnow epoch, instead of J2000, so I was off on the coordinates. The variable star was not centered in the field. I should have centered the stars better in the field of view.
This was really my first try at deliberately capturing photometry data instead of looking at older images and trying to extract data from those. I appreciate your suggestion on grouping the images for better SNR.
A standard deviation from ~180 data points would be considered very representative of the precision of your measurements. Your calculated precision of just a few percent (~1-3%, 0.01-0.03) would normally be considered very good. Achieving a precision of a few tenths percent is typically difficult. I’m a little surprised at how good the Seestar data is!
Typically, using 100+ data points in your period analysis would yield reliable results. Often, fewer are taken.
In terms of how many images to group, why not just try a few different tests and note the result/improvement. Stacking N images should improve your SNR by the square root of N. Test this and see what you get for your comps. It won’t be perfect since other errors may be impacting the data.
The main issue with stacking too many of your images is, of course, that the real variation of your target (a variable star not a constant star) will be averaged as well! IF you stacked all the images, you would end up with 1 mean magnitude with no variation/eclipse! IMHO, since your number of data points in your light curve is appropriate for good temporal analysis and magnitude precision is already a few percent with your current stacking procedure, this is reasonable.
BTW, have you considered separating your bayer channels (RGB) so you can report TG (V) magnitudes rather than the ‘clear’ magnitudes I assume you measured?
I did separate the green channel from the data. I should have indicated that.
The choice of stacking in groups of 6 was purely arbitrary. I used it because it was one minute - no other reason. I also thought, since this variable changes rapidly, I could get a fairly smooth curve. I can try grouping in 6/12/24/48/96, or 1/2/4/8/12/24 minutes - although I think for this data set that 24 minutes might be a bit too long. Probably 4 minutes might be the best for this star.
For fainter, or more slowly changing stars, longer stacking times seems to be appropriate. Certainly, it would be a fun experiment to run - although most of my SNR was greater than 200.
Not see how others do or report data, how many data points are usually reported? What sort of subs are typically used?
As I indicated, I am just learning, and this is my first deliberate attempt at taking data, aside from looking at older images of messier objects and trying to learn how to extract the photometric data.
I’ve thought the same, and offer a comparison. The Seestar has a 50mm f/4.9 telescope (focal length 250mm). My small aperture / short focal length system comprises a 70mm f/2.8 prime Canon tele lens (focal length 200mm). Not identical, but not far off.
The Seestar has an RGB colour sensor. I use a ZWO ASI294MM (mono) camera with a V filter.
On one night in August last year I captured the attached light curve for the eclipsing binary ST Ind. The standard deviation for 20 measurements around the peak of the light curve (around HJD 2460548.1) of the variable was 0.016 for a mag of about 11.2. The SD for the Chk star for 20 measurements around the same time was 0.014, with a brighter mag of around 10.75.
Scott’s comp was around 11.1 with an SD of 0.022.
Given the difference in equipment, I’d say the Seestar is doing pretty well, and perhaps within epectations for that aperture and focal length?
Meant to add: sub exposures were 60 seconds, the equivalent of Scott’s stack of 6 x 10 seconds.
Taking Ken’s suggestion, I took the raw data, and grouped into different exposure groups of 10s, 60s, 120s, 240s, and 480s, to see difference in SNR and curve. The number of subs were:
10s - 913 subs
60s - 152 subs
120s - 76 subs
240s - 39 subs
480s - 20 subs
I examined the light curve for VV Uma, and examined the SNR of the check stars.
Here is the data for different group sizes. Looking at the data, the 120 sec (12x10s) groups to be pretty good. All the data doesn’t look bad, but the scatter seems less with 120s exposure.
Looking at the SNR of different check stars, I found that it depends on the check star. Some had good SNR (greater than 150) regardless of the exposure time, while another had poor SNR unless the exposure time was increased.beyond 120 sec.
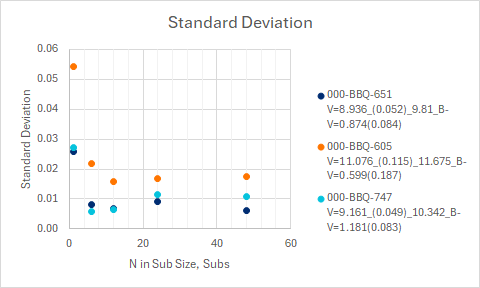
Looking at the standard deviation, and plotting as a function of exposure time, I found that increasing exposure time really depends on the check star, and the SNR. For two of the check stars (BBQ-651 and BBQ-747), a 60 second exposure was enough to drive the standard deviation below 0.01. For the other check star (BBQ-605), it would need 120 sec exposure to drive the standard deviation below 0.02. BBQ-605 also had the lowest SNR.
This analysis taught me that I really need to pay attention to the check/comparison stars, and that I really need to have groups of at least 60sec to have meaningful accuracy and precision.
One additional important item that I learned when examining my data, it that the sensor seems to get saturated at a magnitude 8, therefore I need to focus on variables between about 8.5 and 15.
All in all, I think this was a pretty useful analysis, as I got a better understanding of the instrument.
I would appreciate any comments or suggestions of where to go from here. As I said, I am very new at this and really don’t have a clue.
Best to continue to plot magnitude scale with brightest at top as you did previously. Not a big issue for your analysis here but more common.
One unfortunate occurrence is that the scatter got worse at the most inopportune moment (time of minimum)? I suspect this was perhaps cloud related (??) but there was another spot to far right where another area of similar high scatter exists. Just unfortunate luck!?
Yes, your empirical effort is the best way to ‘learn’ what is going on with stacking vs SNR. Your plot indicates the SNR does improve with more (total) ‘sub-exposures’. I would have plotted SNR versus the number of images (N) that you stacked in a ‘group’. Note that you used a log scale (x axis) to see a straight line so the relationship is not linear. As I mentioned previously, try to plot SNR vs N (or then square root of N) and see what results.
In the standard deviation plot, perhaps you could do a similar comparison (N). The Std is quite poor for the raw individual (unstacked) 10 sec image. (Even with single 10 sec raw images the Std is not outrageously poor with the Seestar! Usually scintillation is reduced at about >10 sec exposures.) Average stacking reduces the Std significantly with your first stacking (6 subs) but then shows very little change. Yes, perhaps still a significant improvement at a stack of 12 subs but not as much beyond (±)? So, diminishing returns with more subs.
Note that all of these analyses/plots address precision (repeatability) but not accuracy (closeness to true value). You could plot your measured mags - known mags for the check/comp stars to evaluate accuracy. Your agreement of your Seestar TG mag with V appears quite good even without transformation?
Want to pursue these comments with more effort? It does appear that you are generating good results and you have identified ways to improve them, which you have shared with all!.
Thank you Ken - I appreciate your comments. As I indicated earlier, this was the first deliberate attempt to measure a variable (other than failed visual when I was a teenager 50 years ago). Regarding your comments:
I can change the plot - I just used the standard EXCEL chart without modifications. That really isn’t a big deal.
I think I was just unlucky. While I use a dew shield to minimize light, I think I may have picked up some light at the wrong moment from either the neighbors lights, or my house lights. The telescope was sitting on a table on my deck, so it is possible that some incident light from the kitchen may have been picked up by the SeeStar.
Looking at the SNR v N, going beyond a sub-group size of 24 10-sec provides little additional benefit. Even a sub-group of 120 sec (12 10-sec subs) has little additional benefit - diminishing returns.
4. The same is true for Std. Dev. as a function of N, I see diminishing returns after about 12 10-sec subs, with 12-24 N looking to be optimum.
I will have to do additional work regarding accuracy, but the charts will show shortly.
Scott
I used ASTAP to stack and debayer the images and calibrate the images. I then extract the green channel, and then I stack the data in groups of 6-12 ten second exposures (60 or 120sec). After stacking, I extract the data regarding the star to the data field. ASTAP identifies the variable, check and comparison stars.
Hi Scott - I just want to emphasize how outstanding this photometry is. Yes - you should listen to the careful analysis of the experts on this channel - and it is clear that you are interested in getting the best out of your data. But it is already outstandingly good and you should be proud. The SeeStar is yet another amazing development that will benefit the work of the AAVSO! Congrats!!!
-Doug
Thank you, Doug. As I indicated earlier, I am an absolute newbie. Fifty years ago I tried visual but had dismal results. Later I looked at using CDS detectors and other ways of detecting magnitudes. I tried to design an automated telescope capable of locating and capturing data, but the state-of-the art was a bit primitive (and expensive) to accomplish these goals. With the SeeStar and now with its planning capability, many hours of capture are possible from my light polluted skies.
Based on these comments, it looks like I am starting to be ready for prime-time, and start submitting reports.
IMHO, you’ re certainly ready to submit your TG data. Regularly look at how well your observed check magnitudes agree with their known mag. This will give you some confidence in the mag of your targets. From your comp data above, you are getting TG mags that agree with their V mags at about 0.03 - 0.08 mags.
You might also learn about transformation and collect images of a standard field to calculate your transformation coefficients. You could then submit your data as transformed V magnitudes as opposed to TG mags.
However, in the meantime, just enjoy imaging and continue practicing your TG photometry.
Calculation of my transformation coefficients are next on the “to-do” list. Another item is to figure out which variables to collect data within the narrow confines of my deck and front yard
I realized that I had the standard field M67 already imaged recently. I took 150 images, calibrated them, extracted the green channel, then stacked them in groups of six 10-sec exposures to give me 25 images. Then I used ASTAP to calculate the transformation coefficient. I obtained:
Delta V = -0.186+0.173(B-V)
This was done using 36 stars. Standard deviation of measured magnitude vs Gaia transformed for stars with SNR>40 and without B-V correction is 0.093.
That is one item off my list - I was surprised how easy it was to accomplish using ASTAP.
Now to start imaging some variables, and hope that the weather clears up.